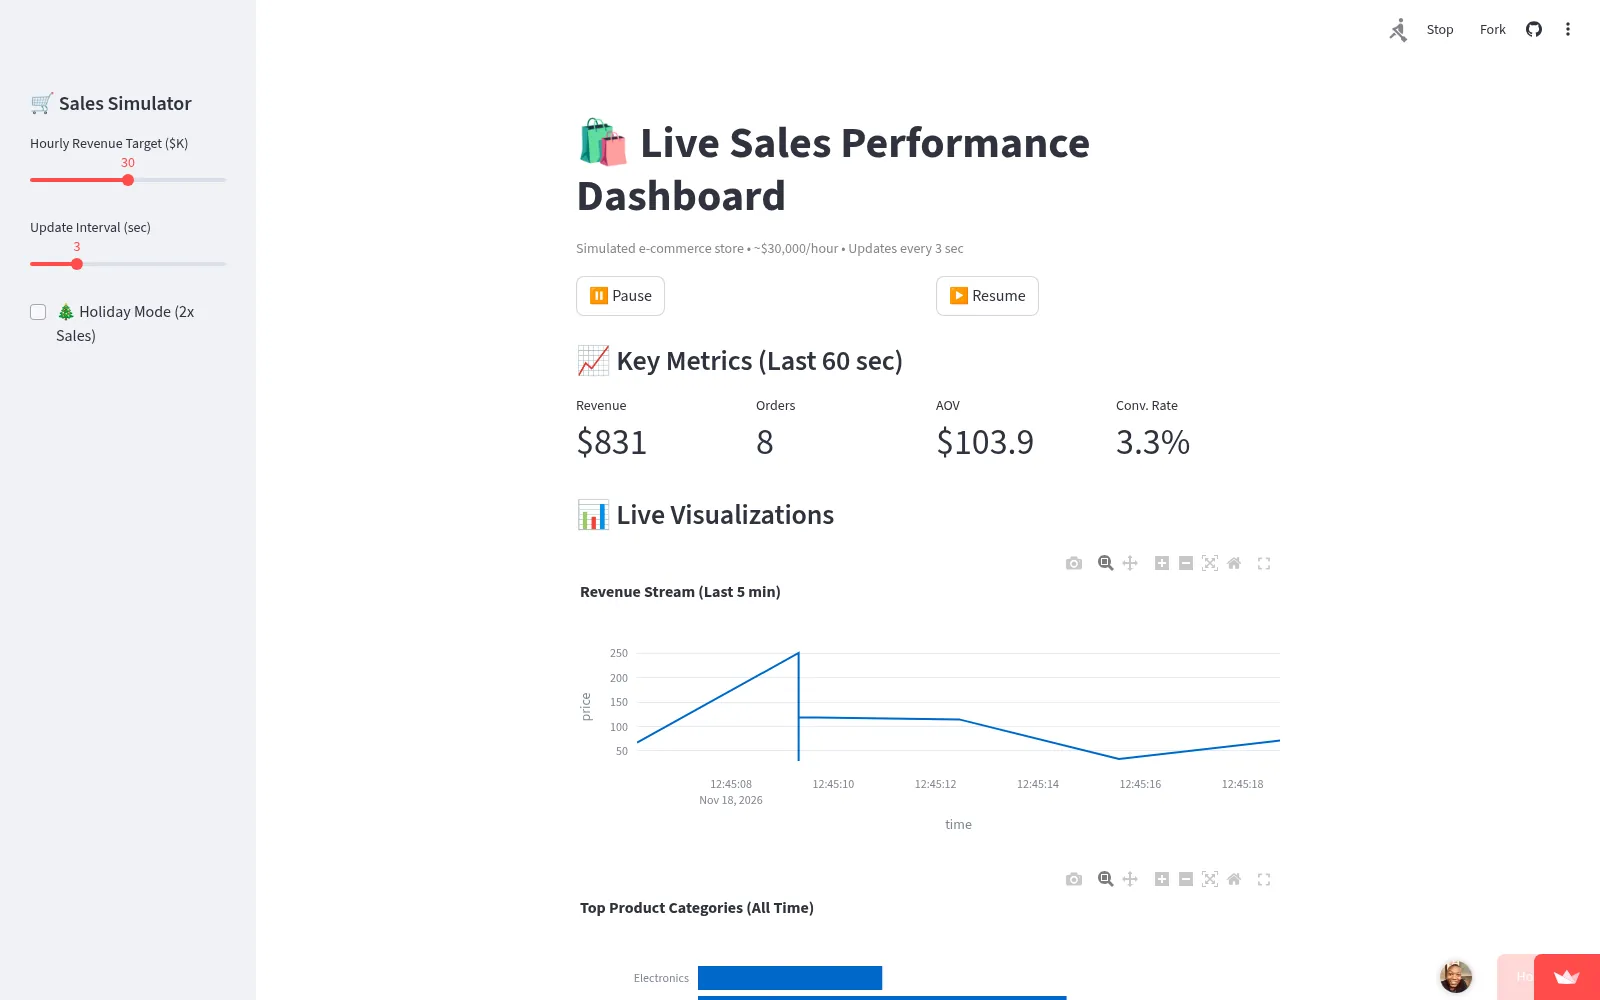
Live Sales Performance Dashboard
Case study ↗A real-time dashboard simulating live e-commerce transactions, demand swings and conversion, modelled on the views revenue teams use daily.
- Python
- Plotly
- Streamlit
- Pandas
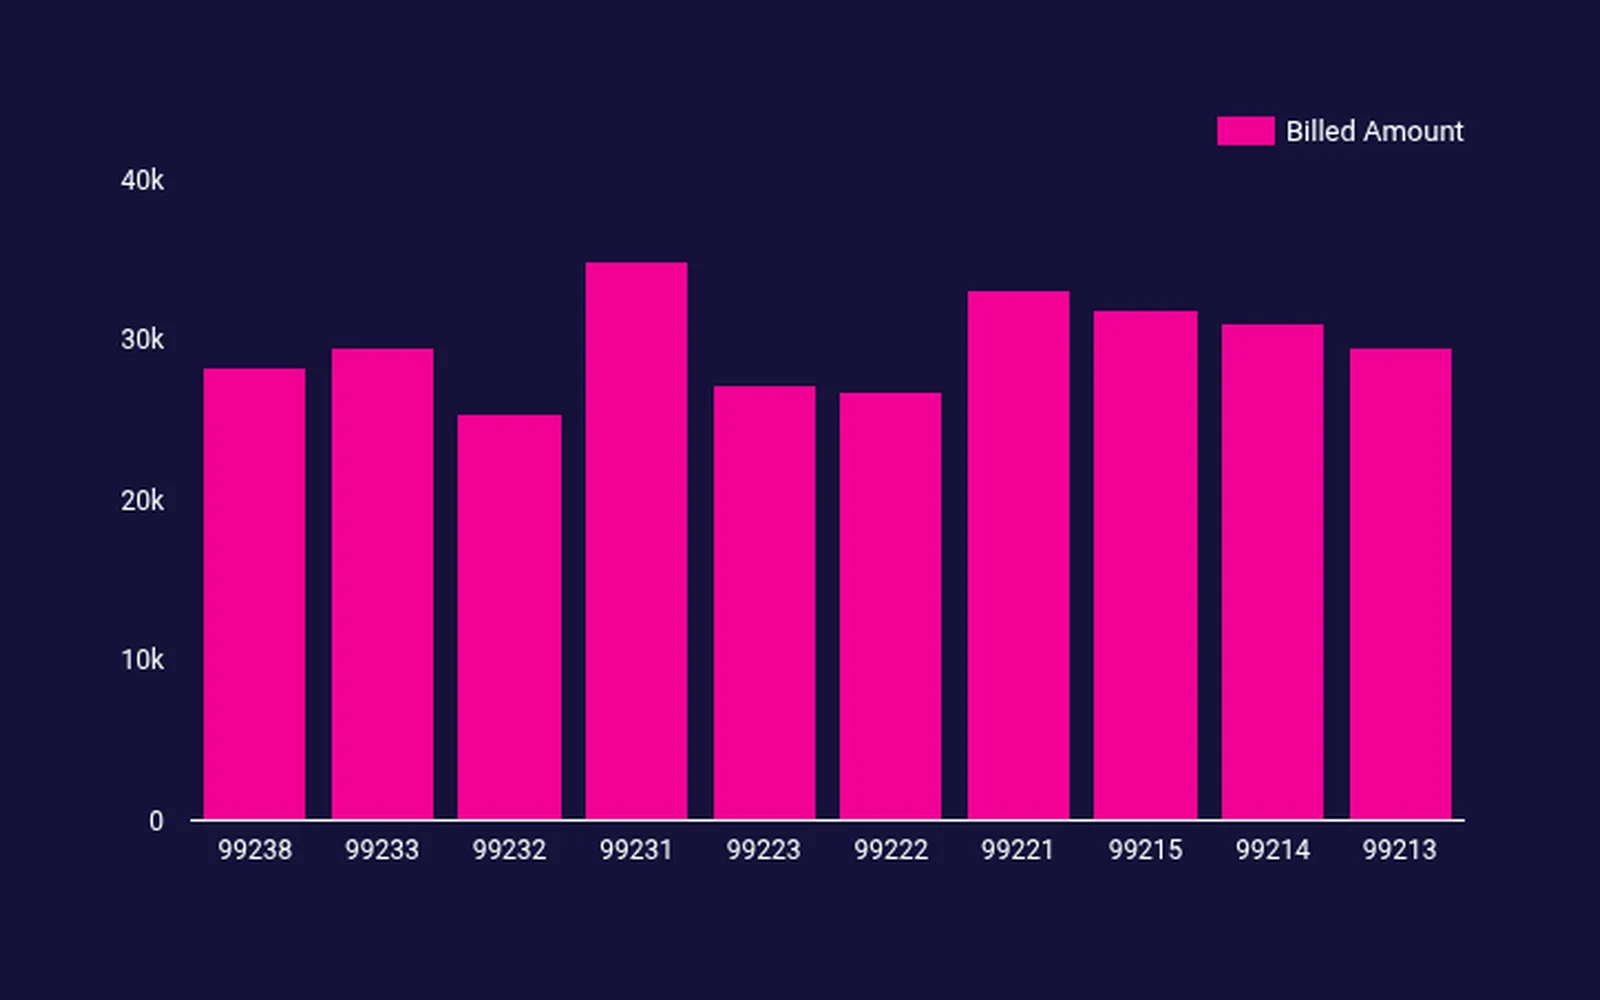 02 · Healthcare finance
A real-time dashboard simulating live e-commerce transactions, demand swings and conversion, modelled on the views revenue teams use daily.
Flags customers at risk of leaving using tenure, monthly charges and service usage.
144,000 tweets analysed to read public perception in the two months before launch.