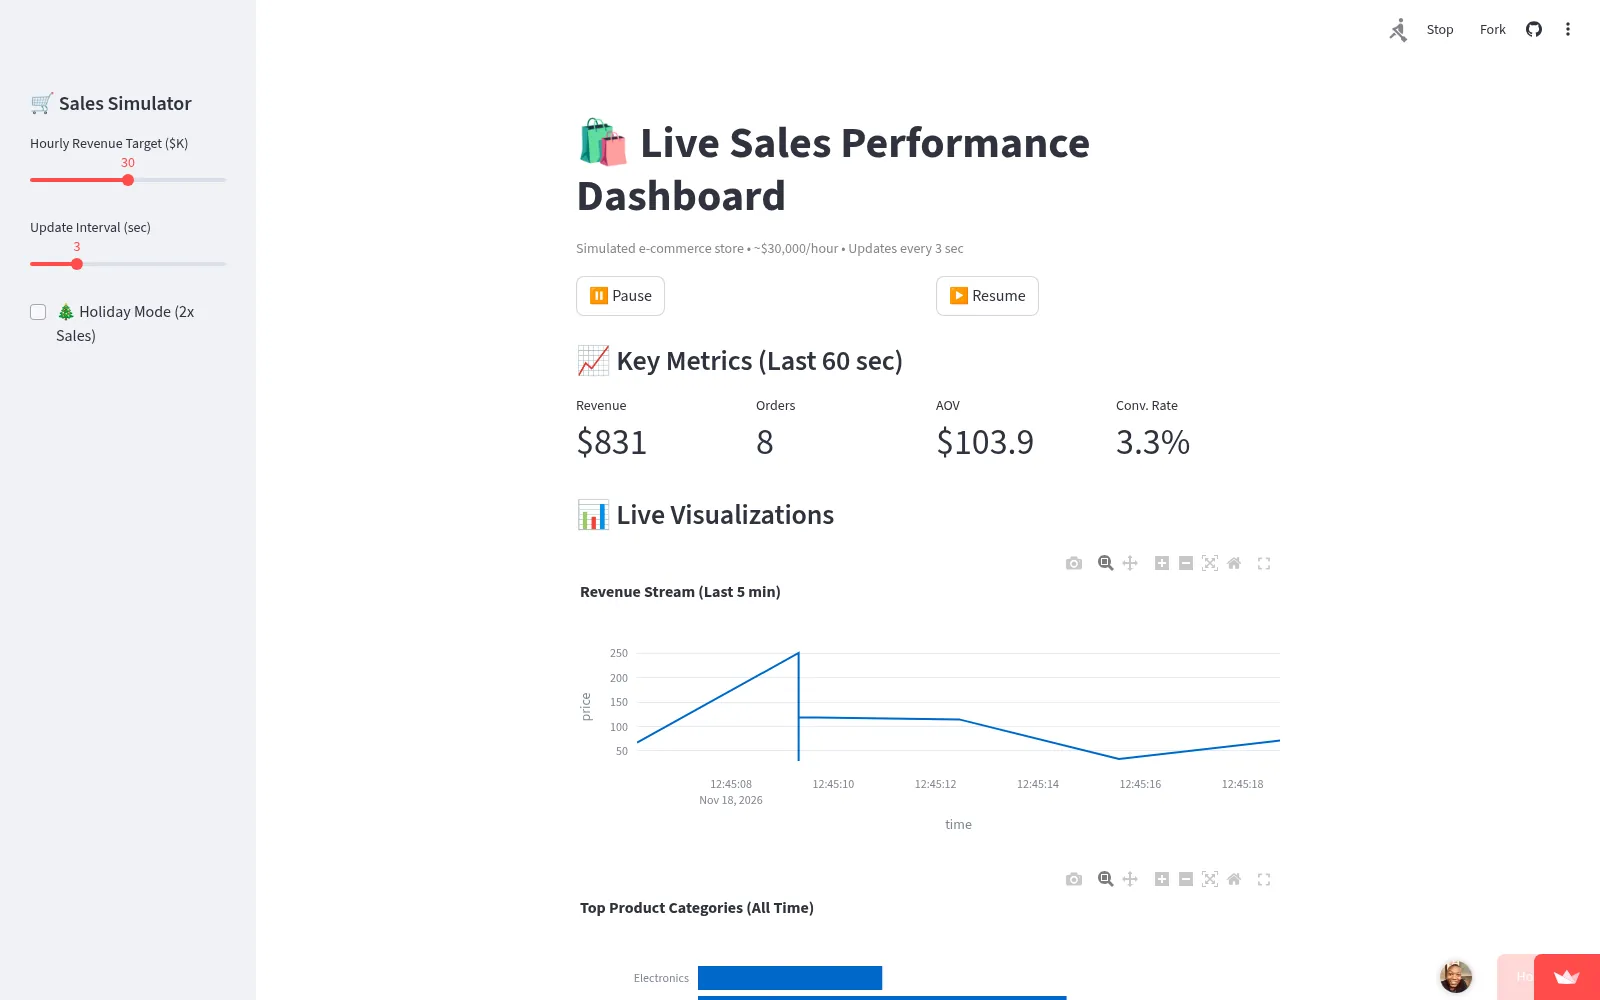
Live Sales Performance Dashboard
Case study ↗A real-time dashboard simulating live e-commerce transactions, demand swings and conversion, modelled on the views revenue teams use daily.
- Python
- Plotly
- Streamlit
- Pandas
 03 · Predictive model
A real-time dashboard simulating live e-commerce transactions, demand swings and conversion, modelled on the views revenue teams use daily.
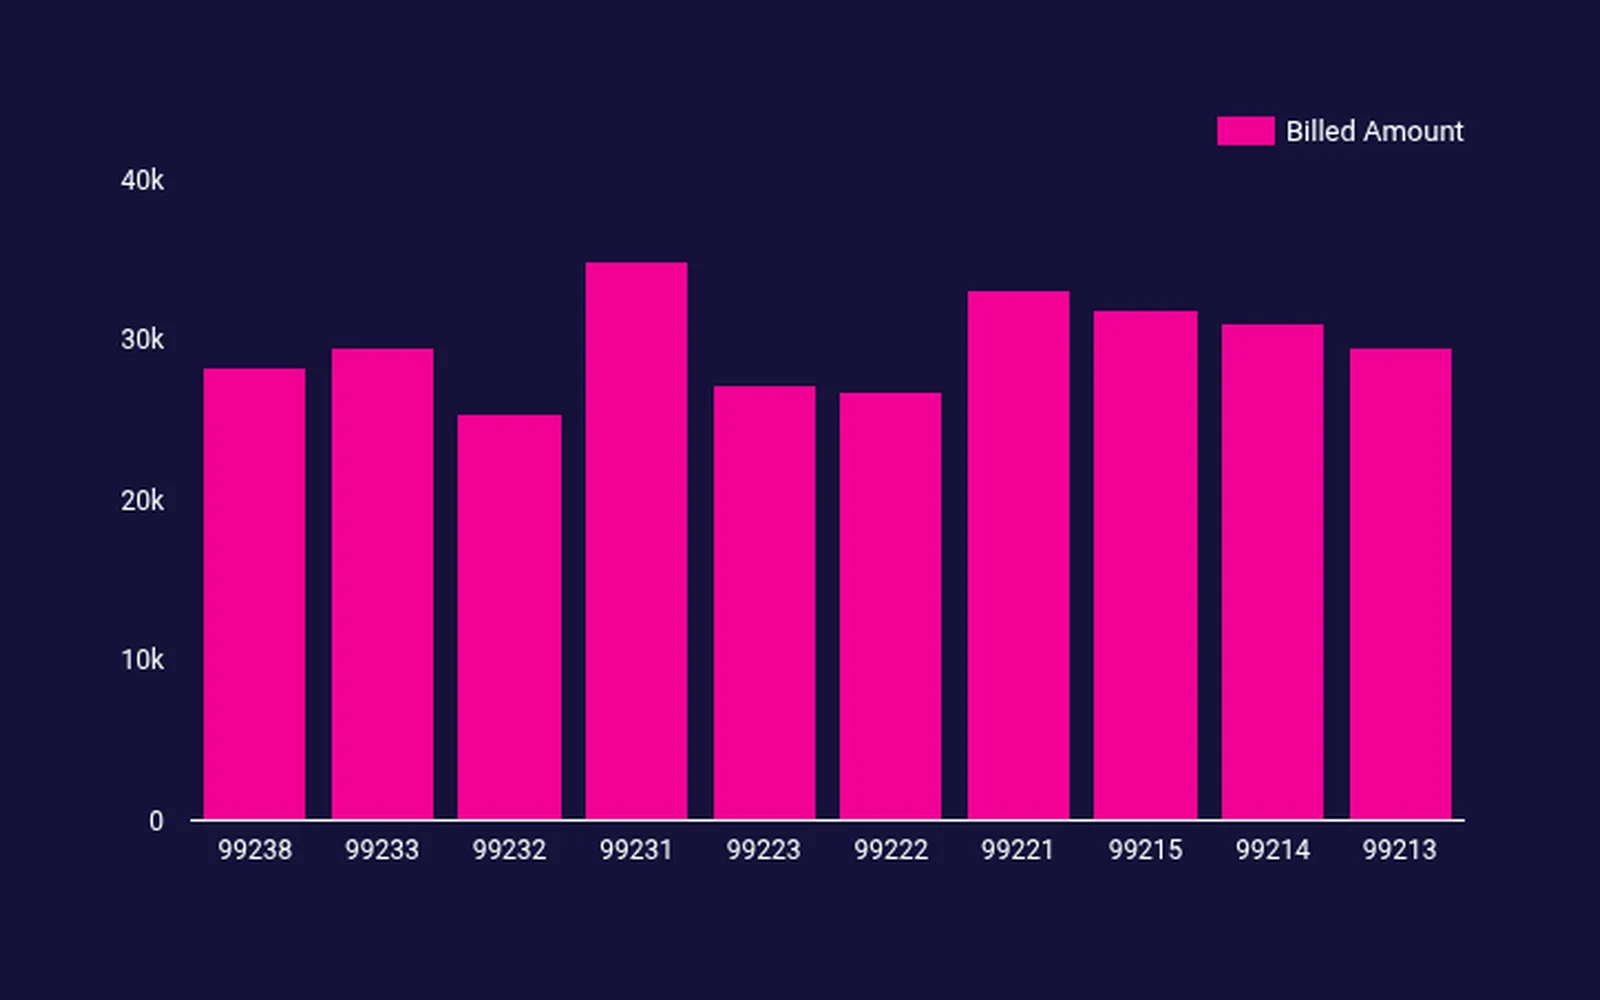
Financial, operational and clinical KPIs in one view, tracking $297K billed against a 97% reimbursement rate.
144,000 tweets analysed to read public perception in the two months before launch.